
Brain reconstruction
Trace, proofread and annotate.
Together, in the browser.
Collaboratively trace neurites, proofread segmentations and reconstruct circuits from electron-microscopy and light-sheet volumes — in the browser, streamed from your own storage. No copies, no lock-in.
Trusted by leading research institutions worldwide













~49%
lower cost to analysis-ready data

70%
less manual correction effort

Zero
data movement — runs on your own storage

Minutes
to share a reproducible 3D view
Reconstruction modules
From raw volume to validated reconstruction
Every step of the connectomics pipeline is a NeuroGlass module, run on dedicated backend services, on your own data. Built hand-in-hand with our design partners.
Beta · design partners
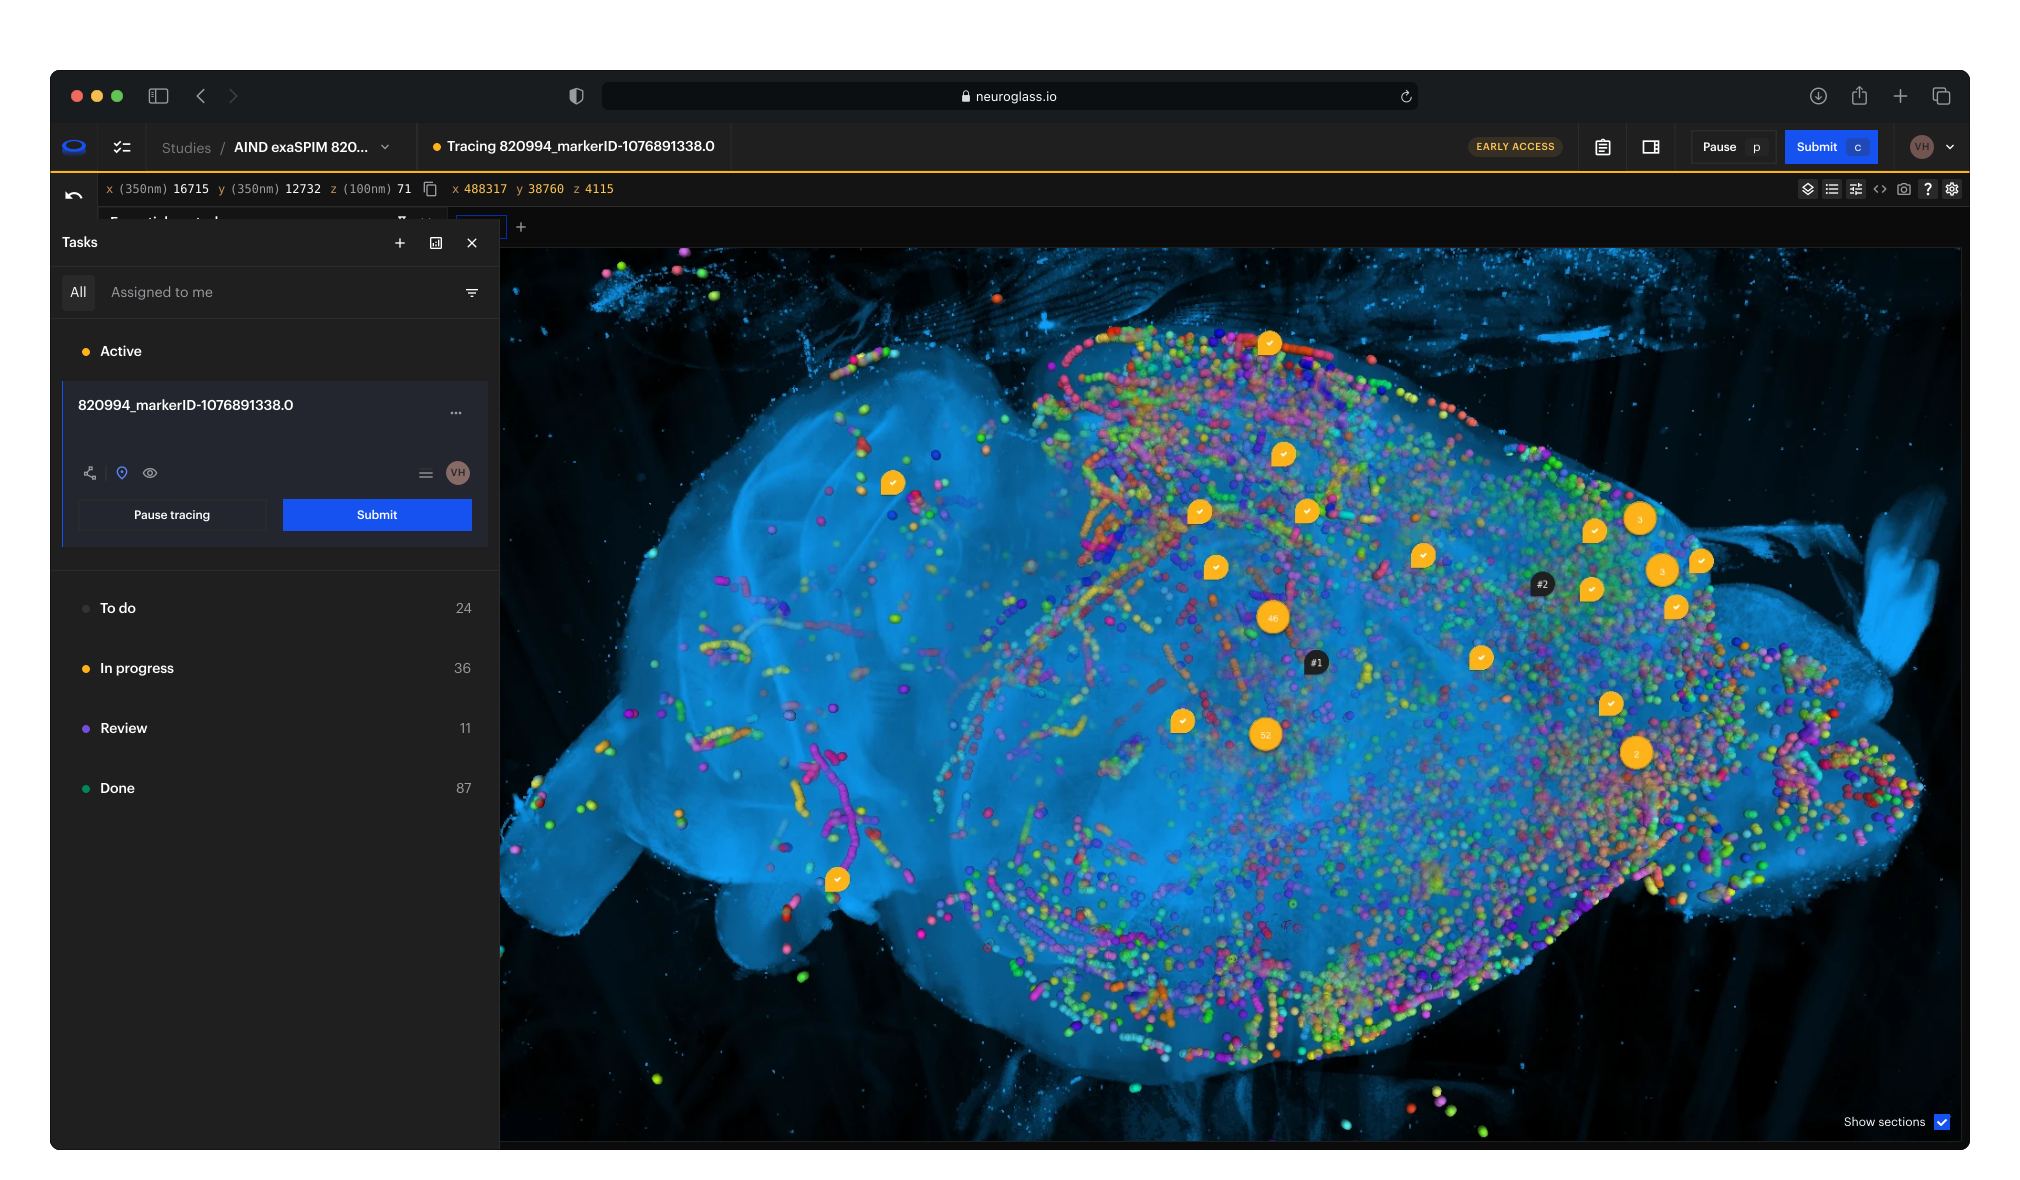
Skeleton Tracing
Light-sheet
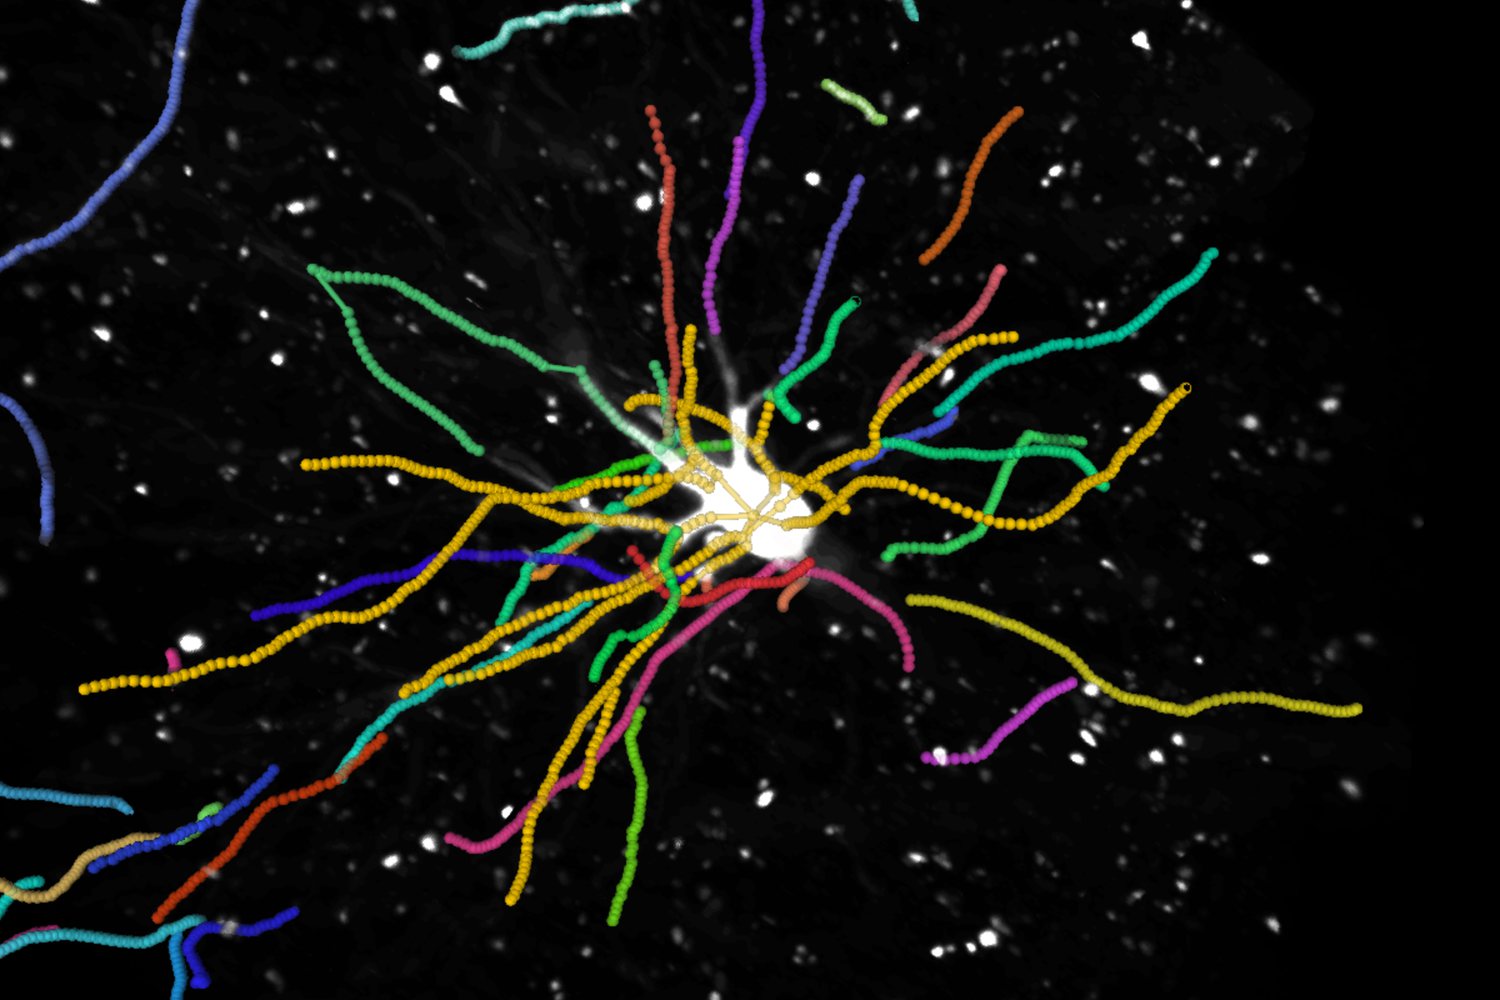
Trace and proofread neurons in the browser with your whole team, one task per neuron, and review each one in the same view.
Coming soon · design partners
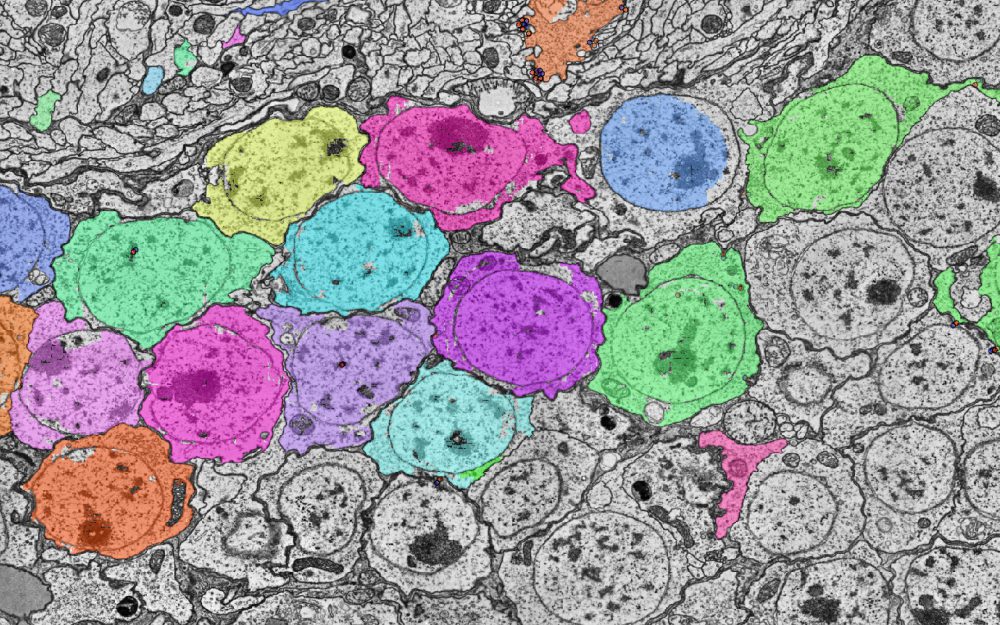
AI Segmentation
Fluorescence · LSFM · EM
Kick off automated segmentation over a region of interest, then monitor and approve the results.
Coming soon · design partners
Beta · design partners
EM Reconstruction
EM · Tomography
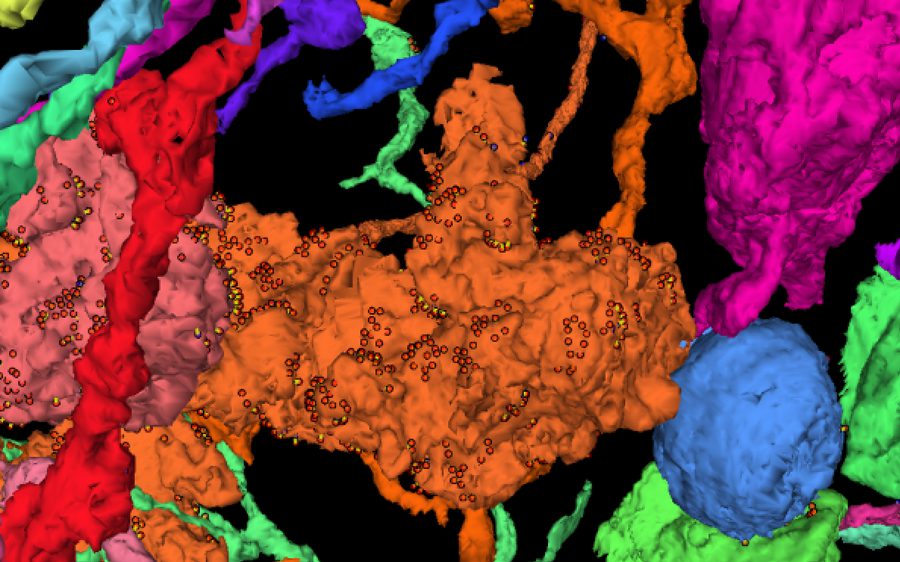
Build and proofread ground-truth reconstructions, with a dedicated proofreading task type and review UX.
Collaborative Annotation
All modalities
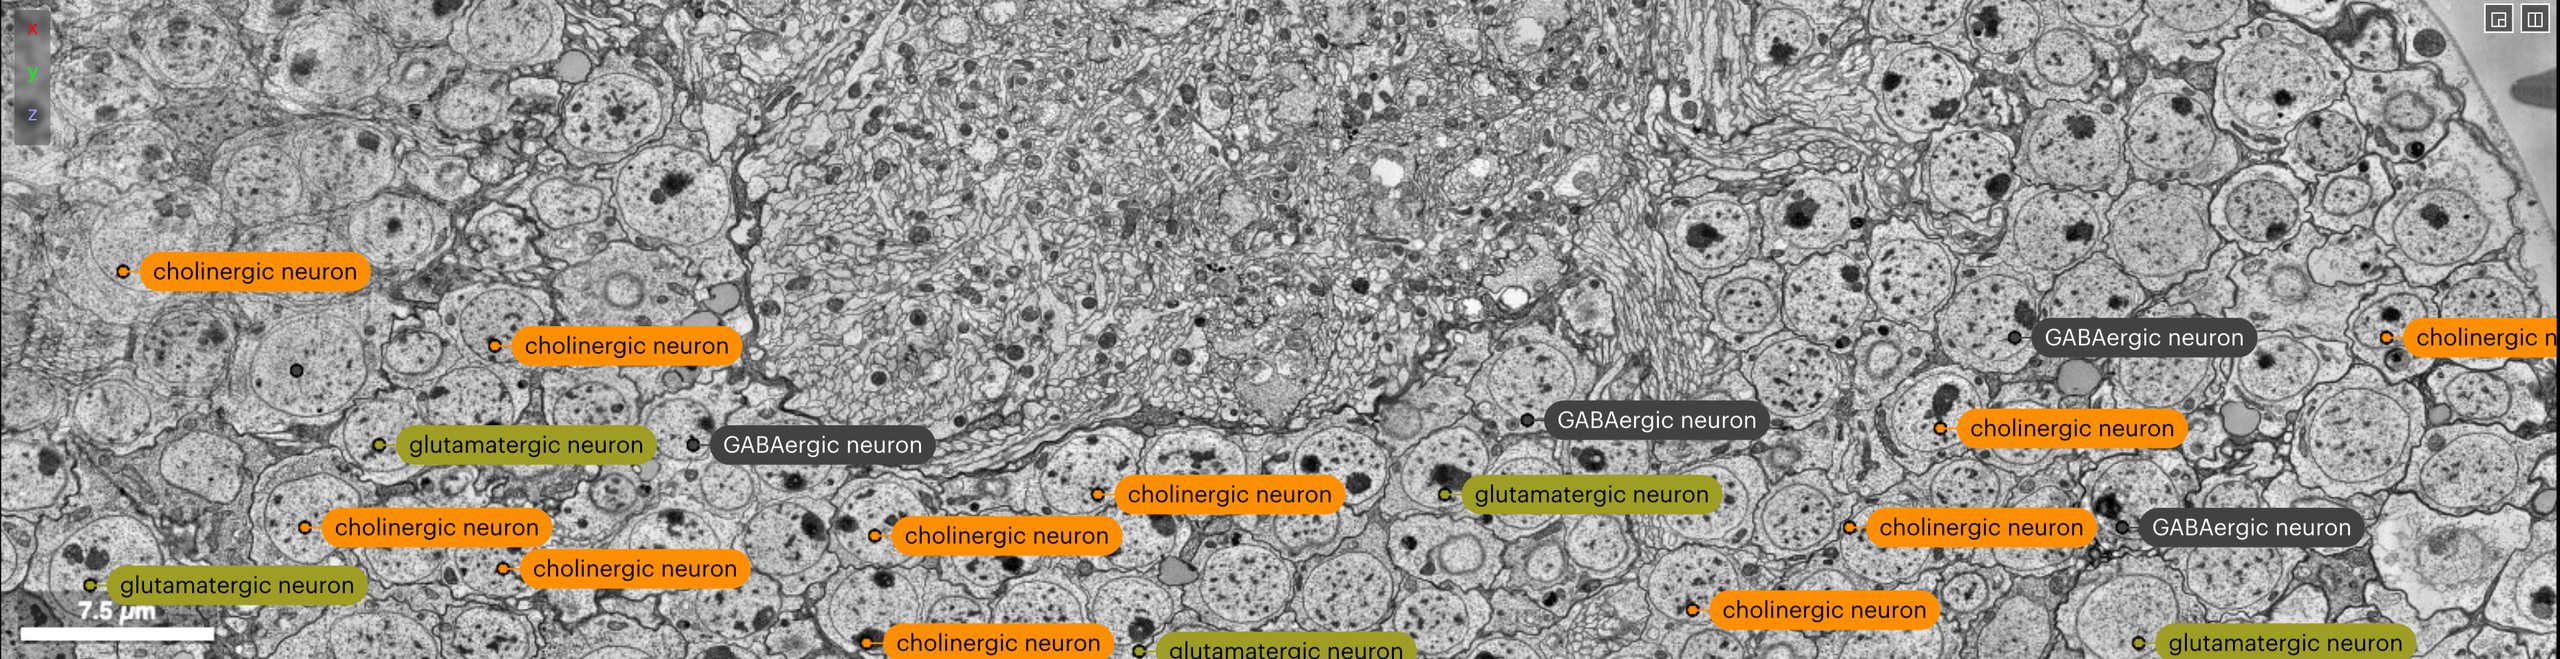
Annotate together on one shared layer, with values from your own lists or ontologies, and find any annotation by its values.
Each ships as a module — explore all modules. Built with our design partners; join the program to shape the roadmap.
NeuroGlass for Research Institutions
Reproducibility, built in
Every finding lives in a persistent, versioned Study. Capture the exact view behind any result as a Glance — reopen it months later and see precisely what you saw, down to the layer, window, and ROI.

runs on your data, wherever it lives
Across every imaging pipeline
Point NeuroGlass at your buckets and it streams EM, light-sheet, X-ray and more directly in the browser — no copies, no data movement. Run it as managed SaaS, or deploy on-prem in Kubernetes on your own cloud, with no external cloud dependencies.
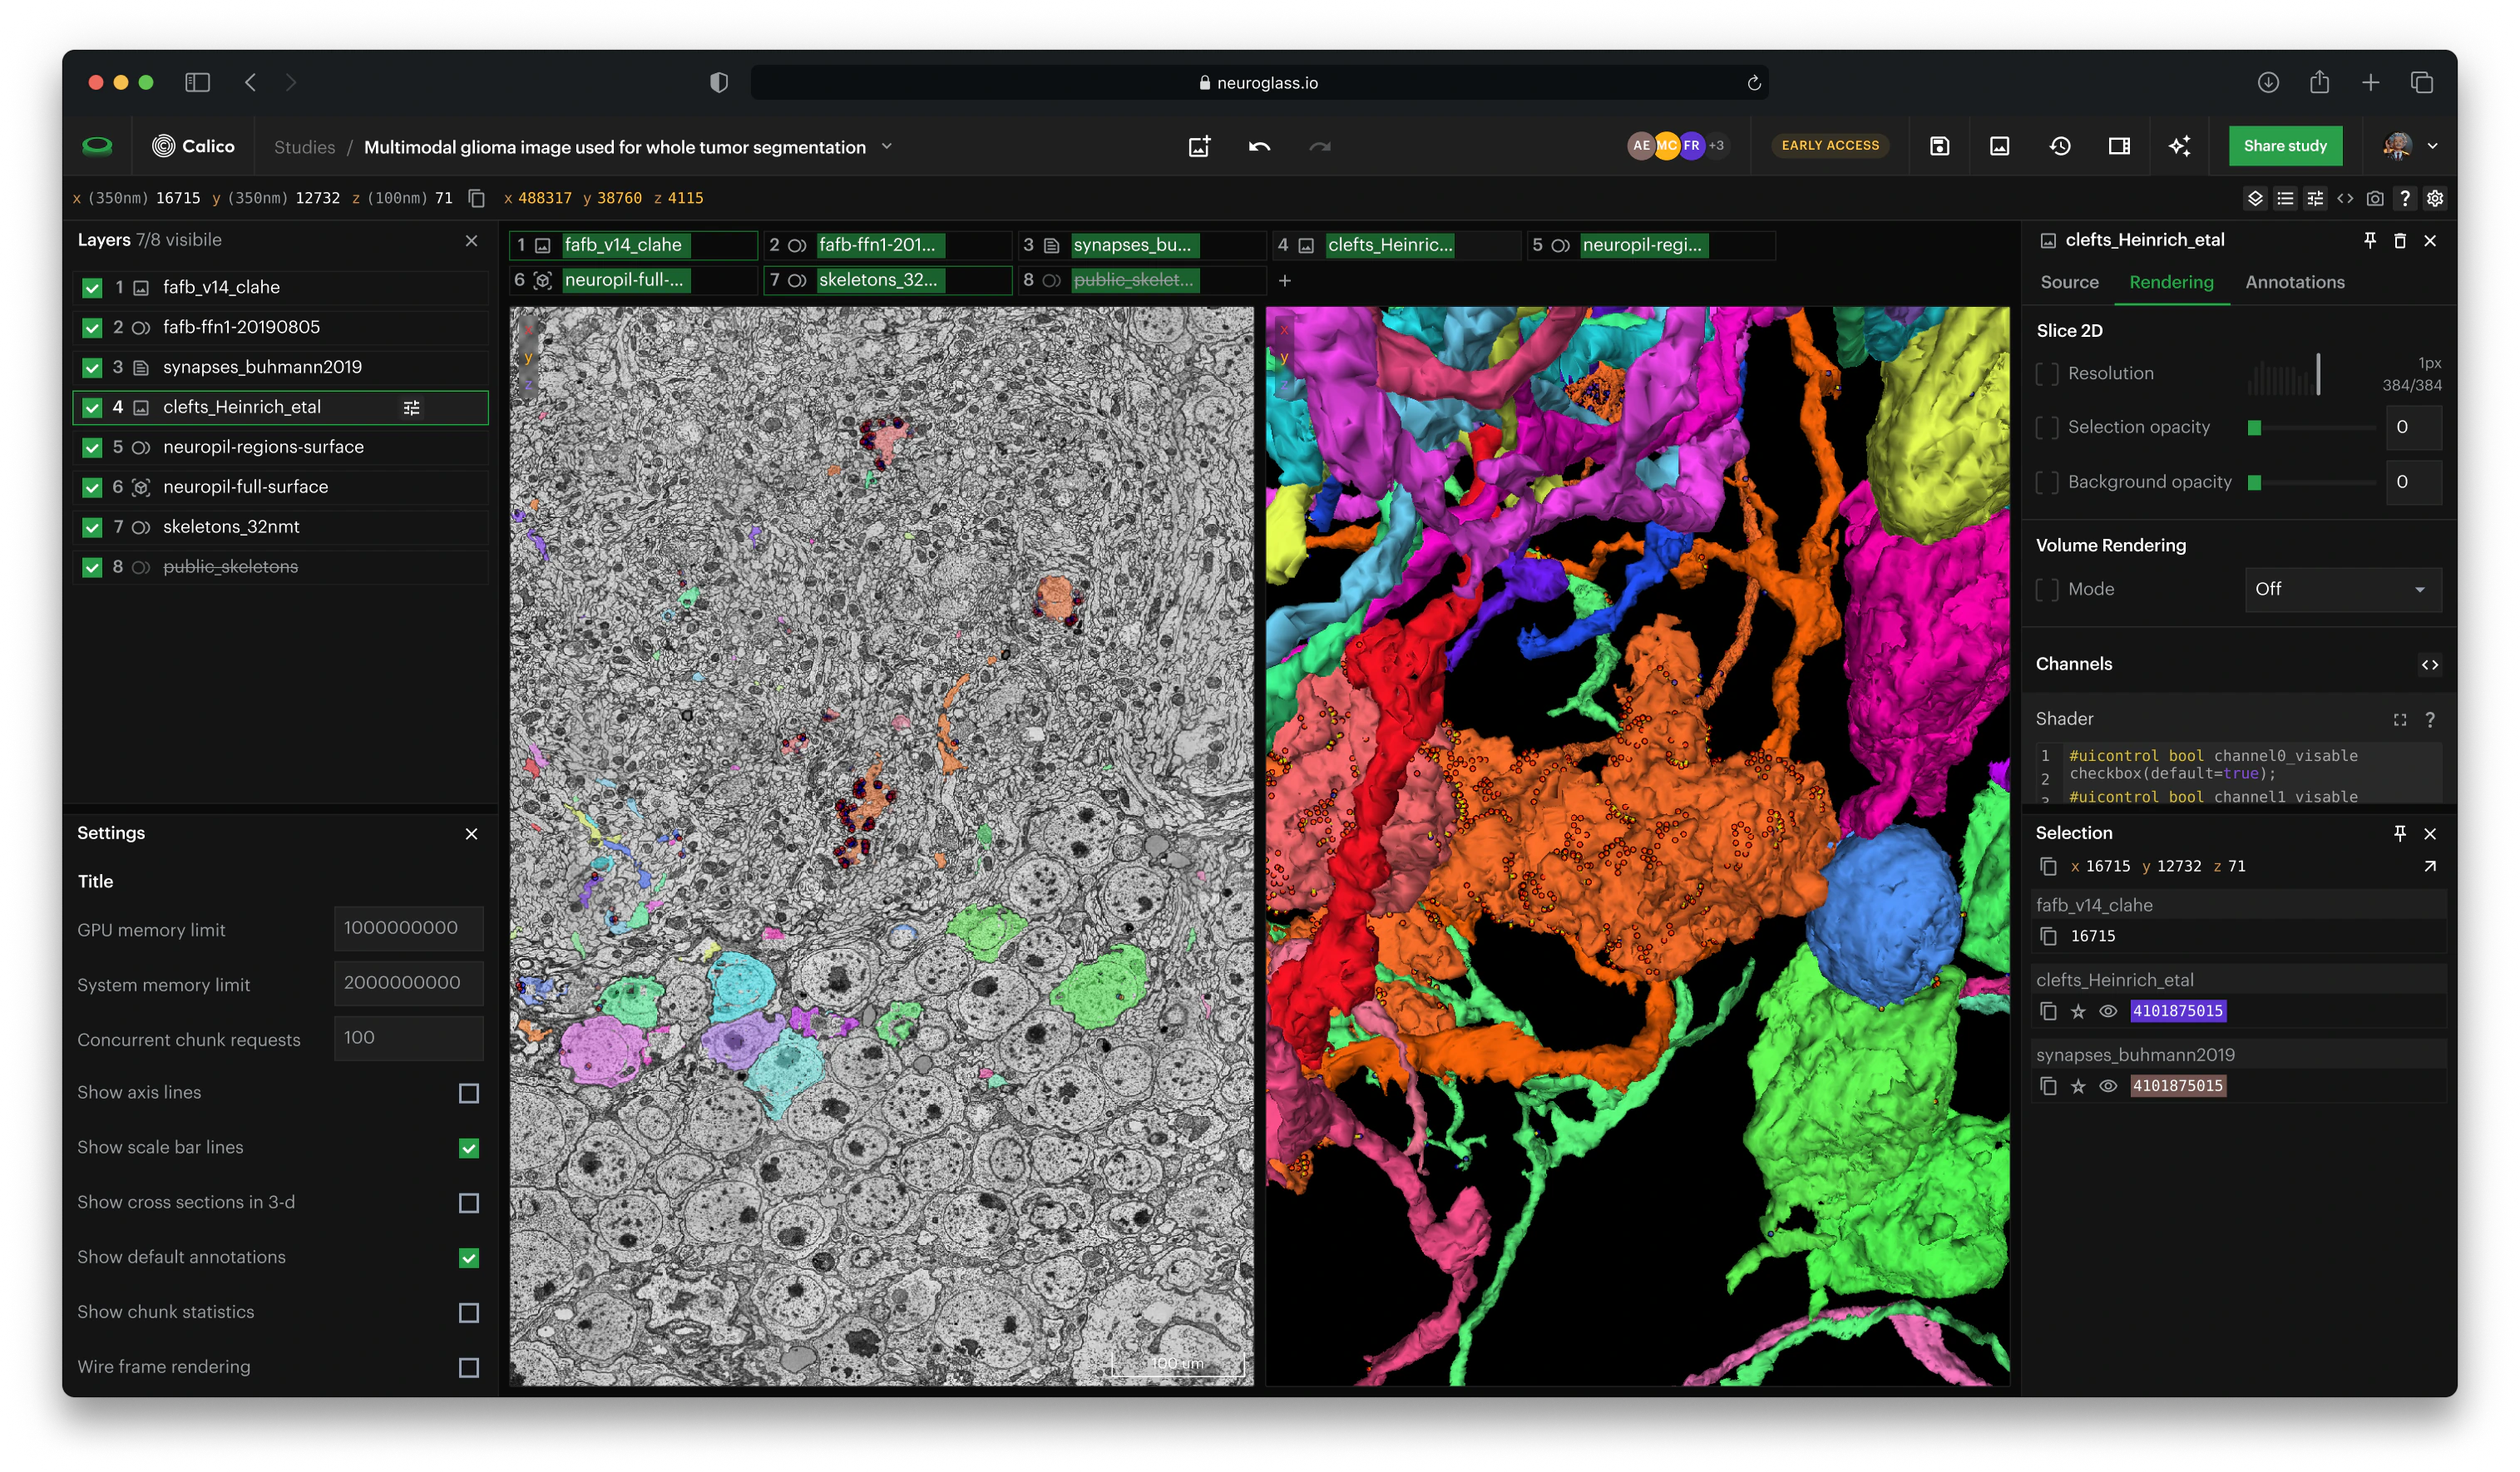
Attributions: Zheng et al., Cell 2018; Buhmann et al., Nature Methods 2021; Heinrich et al., arXiv 2018
your data never leaves your control
You own the data
Your datasets stay in your own private S3 buckets. NeuroGlass streams them on demand and holds only the metadata — nothing is copied out of your storage.
No data movement
Terabyte- and petabyte-scale volumes stream directly from your private buckets into the browser. No uploads, no duplicate copies, no egress bills to move data around.
Secure by design
SSO via your identity provider and Google-Docs-style sharing put access in your hands. Grant, revoke, and audit who can see each Study — your IT and data-governance teams stay in control.
bring your lab directly to the data
Collaboration in the data, not around it
NeuroGlass turns a dataset into a shared, living workspace, so every question, annotation, and decision stays attached to the evidence, not buried in email, Slack, or PDFs.
Share imaging data, annotations, and the exact Glance behind each result with collaborators anywhere
Re-open any Glance months later and see precisely what a colleague saw
Walk your team through volumetric data in a live session, with comments syncing as you talk
Turn any question into a comment tied to a specific spatial point or ROI, with @mentions and threads
Assign and review skeleton-tracing tasks with design partners — in beta today
“Our teams are using NeuroGlass to help us treat visualization not as a private activity, but as an institute-wide workflow, where the context around a view is preserved and easy to revisit.”
ONE COLLECTION. Many lenses.
Compare across datasets
Bundle datasets into a Data Collection. Switch Lenses to change perspective.
Everything stays one click away in your dashboard.
Everything stays one click away in your dashboard.
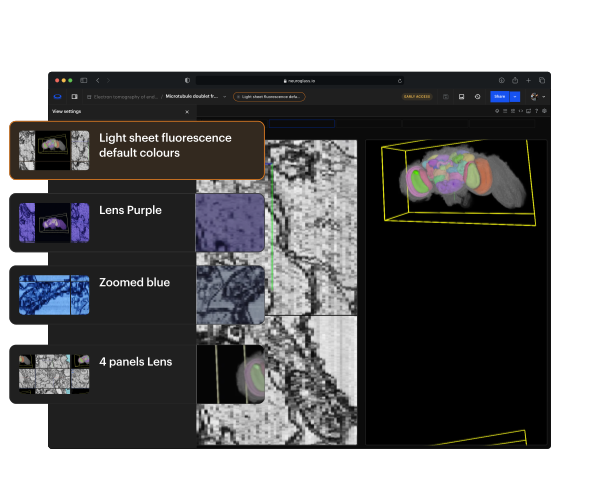
Standardize views
Lenses are parameterizable viewing templates that enforce consistent windowing, overlays, and rendering across datasets and everyone in your lab.
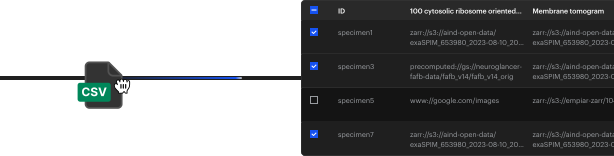
Bulk ingest
Onboard thousands of subjects in one pass with a CSV manifest, no bespoke scripts.
Compare anything
Swap datasets or swap settings. Cross-dataset comparison and longitudinal review stop being engineering asks.
Automate. Integrate. Innovate.
Built for scientists. Ready for developers.
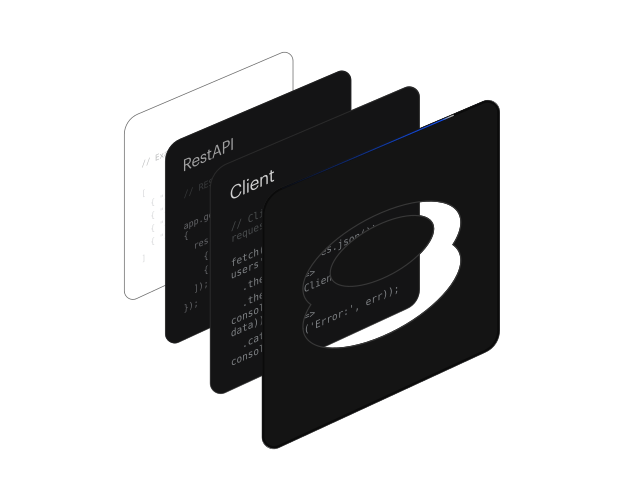
Seamlessly import your data or programmatically create your Studies with our developer-friendly APIs.
Visit API documentation

Documented API access
Documented REST API with Keycloak authorization service
Native integrations
NeuroGlass plugs into your acquisition and analysis pipelines, with DANDI support built in
Programmatic Studies
You keep your stack — script Study creation and ingestion straight from your pipelines
Search across all your Data
Search Studies, Glances, and Collections — and inside the workspace state itself.
"The dataset where we saw that structure" becomes findable.
"The dataset where we saw that structure" becomes findable.
Example results from public datasets.
A link your paper and your data archive can point to
The fastest way to evaluate NeuroGlass is to walk through a real dataset end-to-end.
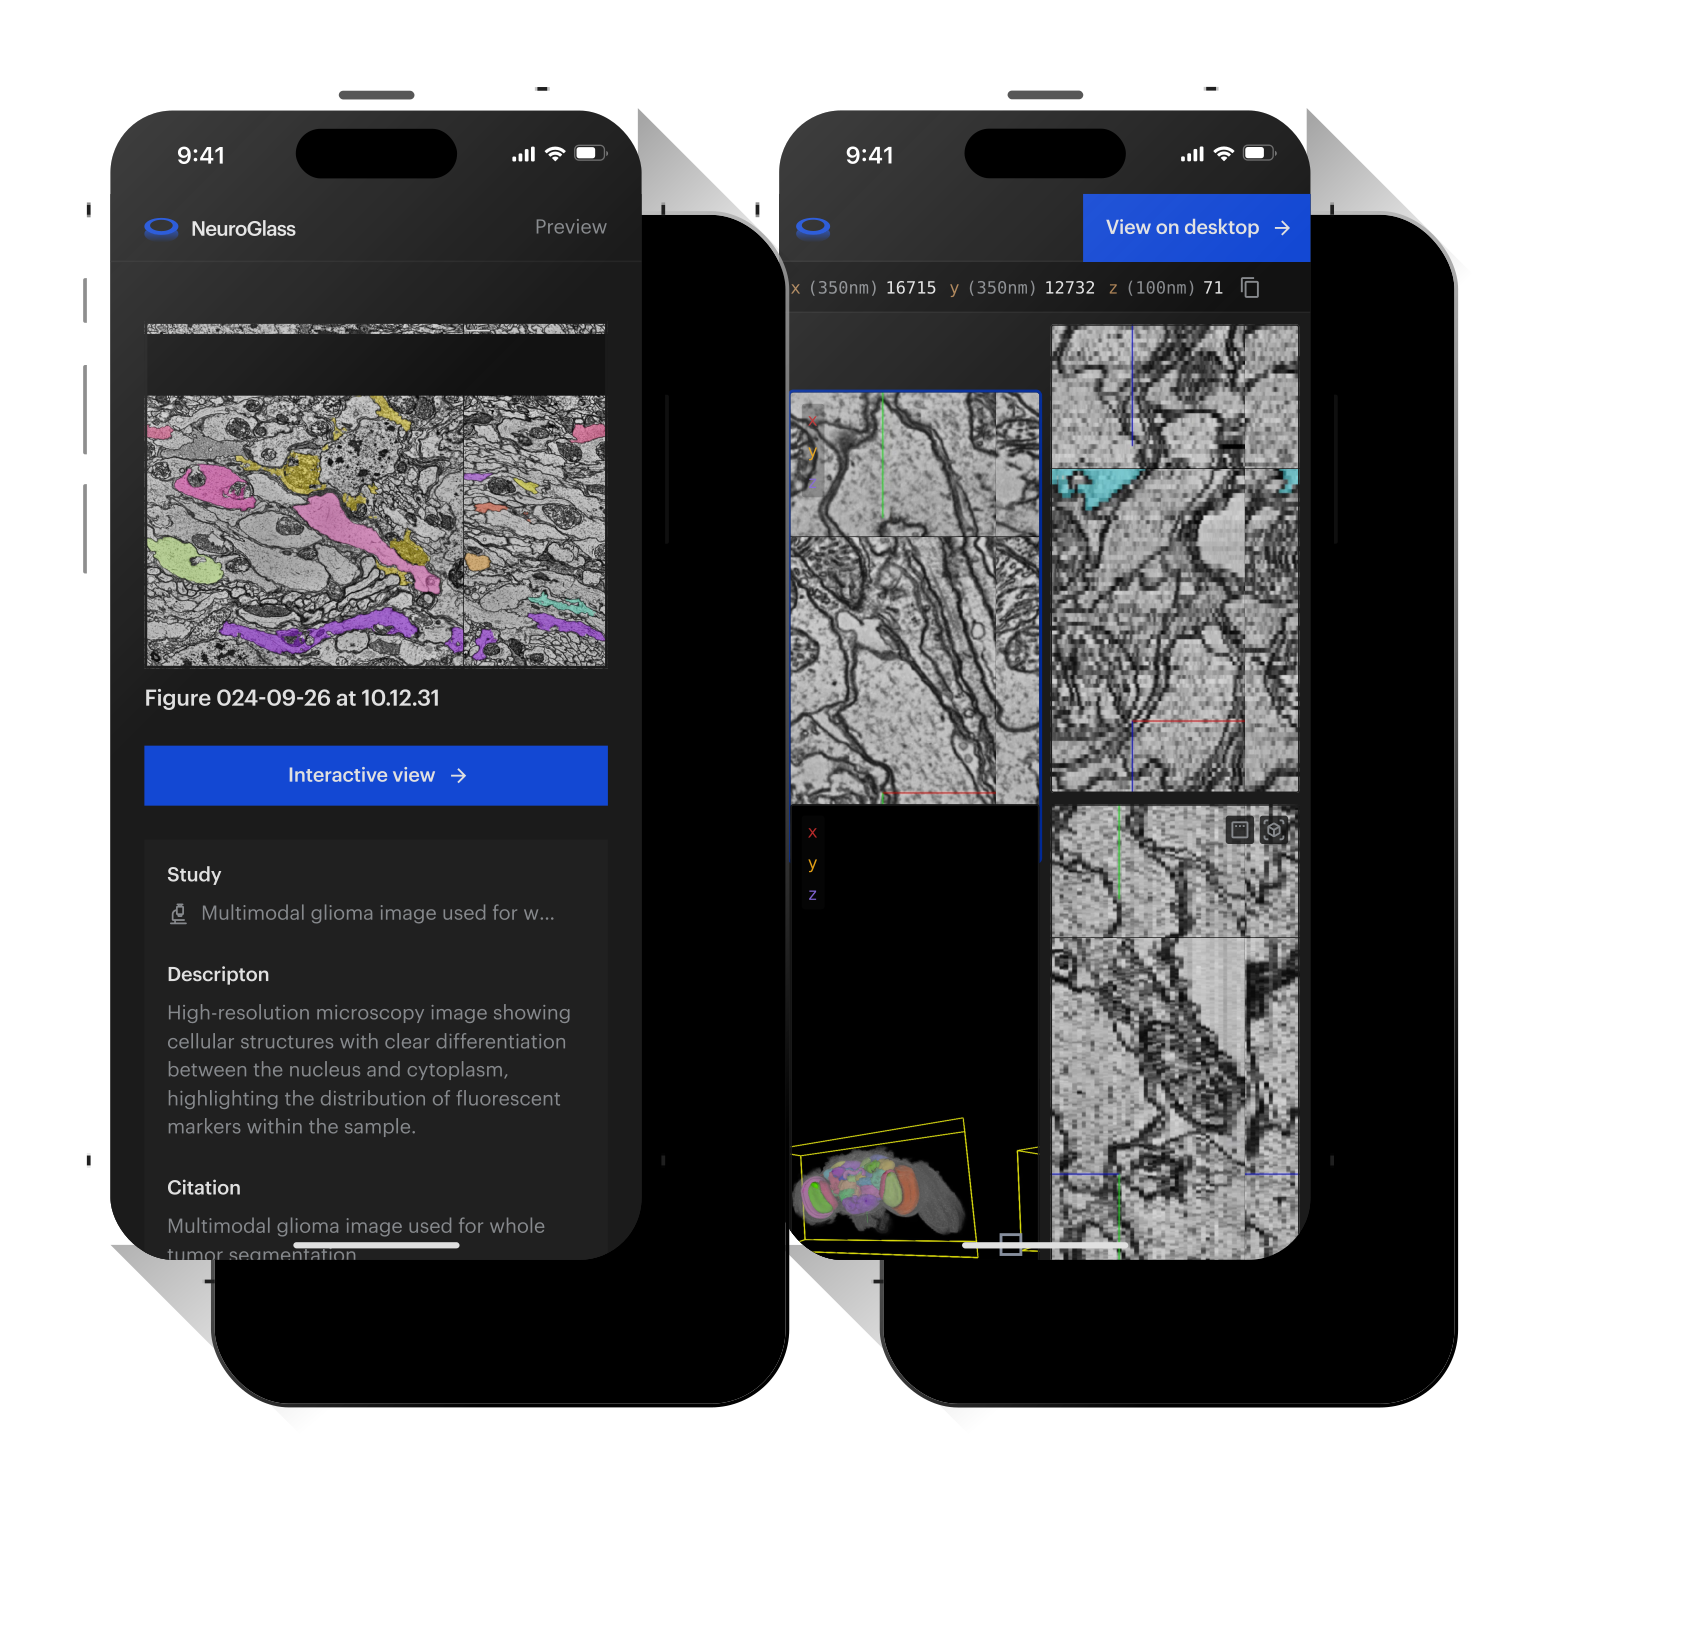
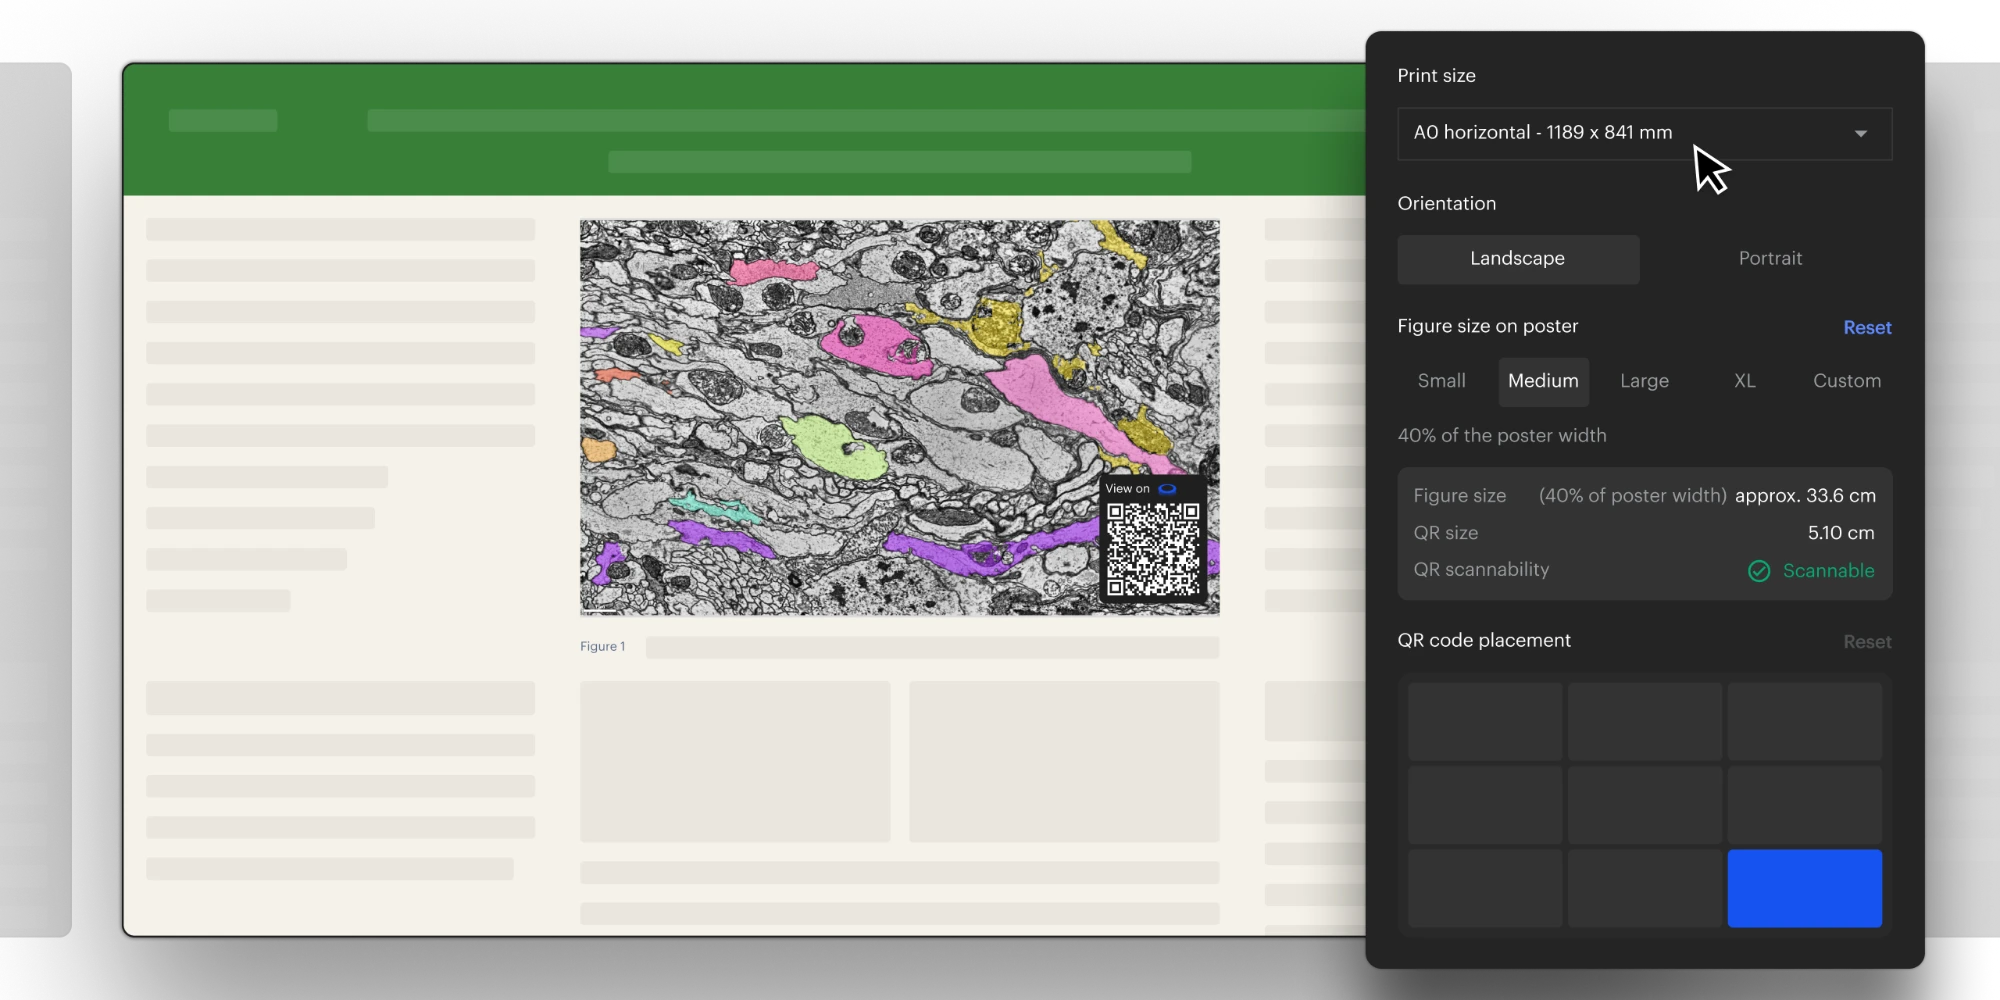
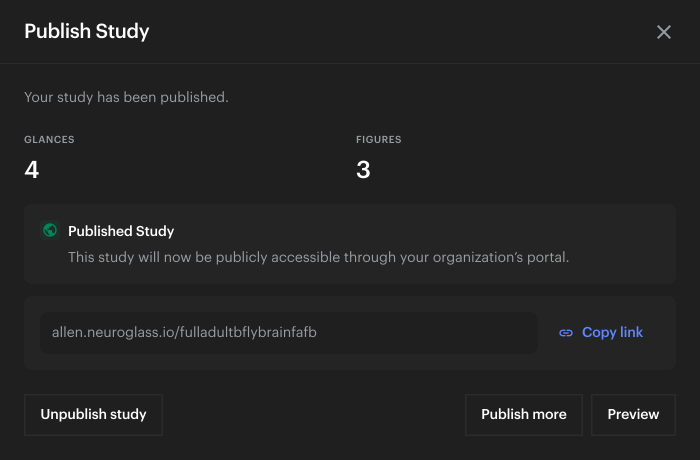
Turn any Glance into a Figure with a link that opens the exact interactive view, not a flat screenshot.
Cite the Figure in the paper and next to the data you share under NIH and BRAIN Initiative policies.
NeuroGlass reads straight from archives like DANDI and BossDB.
Publishing with DOIs is in development with design partners. In development
Frequently Asked Questions
Can't find an answer? Contact us
What is NeuroGlass?
Which data formats does NeuroGlass support?
Do we have to upload or copy our data?
Where is our data, and who can see it?
Can I keep working in Neuroglancer?
Can collaborators at other institutions open our data?
Can our lab start for free?
no lock-in, ever
We co-maintain Neuroglancer
NeuroGlass is the workspace Neuroglancer never had — we wrap the engine, we don't replace it. Your work stays portable: annotations, schema and state remain standard Neuroglancer JSON that opens in plain Neuroglancer. No proprietary formats, no lock-in.
Our improvements to the engine go back to the open-source project, so the whole community benefits — like Red Hat for Linux.
Our improvements to the engine go back to the open-source project, so the whole community benefits — like Red Hat for Linux.
Bring your own volumes to NeuroGlass
Allen Institute using NeuroGlass to support large-scale brain imaging workflows
Read the Press Release


